Explore cricket statistics analysis, key metrics, data visualization, and real-world applications to enhance performance and improve your game. FAQs included!Welcome to the world of cricket analytics, where numbers tell a compelling story that transcends traditional game commentary. Analyzing Cricket Statistics: What You Need to Know delves deep into the rich tapestry of cricket performance metrics, revealing insights not just for fans and analysts, but also for players aiming to elevate their game. From understanding the basics of statistics to exploring key metrics and data visualization techniques, this article equips you with the tools to decode the game like never before. By analyzing cricket statistics, you can make informed decisions that lead to improved performance, whether you’re coaching a team or stepping onto the pitch yourself. Join us as we explore how data-driven insights are revolutionizing the way we appreciate and engage with cricket.
Understanding The Basics Of Analyzing Cricket Statistics
When it comes to analyzing cricket statistics, understanding the foundational concepts is essential for gaining meaningful insights. Statistics in cricket can seem overwhelming due to the vast array of data available; however, by breaking down the basics, one can effectively interpret and utilize this information.
At its core, analyzing cricket statistics involves understanding various performance metrics that quantify a player’s contributions on the field. This includes but is not limited to batsmen averages, strike rates, bowling economy, and fielding efficiency. Here’s a breakdown of some essential elements:
| Metric | Description | Importance |
|---|---|---|
| Batting Average | The total runs scored divided by the number of times a player has been dismissed. | Opens a window into a batsman’s consistency over a period. |
| Strike Rate | The measure of how quickly a batsman scores runs, calculated as (Runs Scored/Balls Faced) x 100. | Crucial for understanding a player’s ability to accelerate the scoring. |
| Bowler’s Economy Rate | The average number of runs conceded per over bowled. | Indicates a bowler’s efficiency and control. |
| Fielding Percentage | The percentage of successful fielding attempts (catches, run-outs) against total opportunities. | Reflects a player’s impact in the fielding department. |
Once familiar with these metrics, the next step is to contextualize them within different match scenarios or varying conditions. For instance, understanding how a player’s statistics hold up on different pitches or against specific types of bowlers can provide deeper insights. Additionally, tracking performance over time allows for a more comprehensive view of a player’s development and consistency.
analyzing cricket statistics is not just about collecting numbers; it’s about deriving actionable insights that contribute to a deeper understanding of the game. By mastering the basics, fans, players, and analysts alike can enhance their appreciation and strategy within the cricketing world.
Key Metrics To Focus On When Analyzing Cricket
When analyzing cricket statistics, there are several key metrics that provide a comprehensive view of player performance and team dynamics. Understanding these metrics is essential for making informed decisions, whether you are a coach, analyst, or a passionate fan. Here are some of the most important metrics to consider:
| Metric | Description | Importance |
|---|---|---|
| Batting Average | The total number of runs scored divided by the number of times a player has been out. | Indicates overall batting performance; higher averages signify better performance. |
| Strike Rate | The number of runs scored per 100 balls faced. | An essential metric for assessing scoring tempo; particularly critical in limited-overs formats. |
| Bowling Average | The total number of runs conceded divided by the number of wickets taken. | A lower average indicates better performance from bowlers. |
| Economy Rate | The average number of runs conceded per over bowled. | Crucial for bowlers, especially in limited-overs matches; reflects their ability to contain runs. |
| Wickets Taken | The total number of wickets a bowler has claimed during matches. | A fundamental measure of a bowler’s effectiveness. |
| Runs Scored | The total number of runs achieved by a batsman. | Essential for evaluating a player’s contribution to the team’s score. |
By focusing on these key metrics, you can gain valuable insights into both team and individual performances. As you delve deeper into analyzing cricket, be sure to consider how these metrics interplay to provide a fuller understanding of the game.
How Data Visualization Enhances Analyzing Cricket Statistics
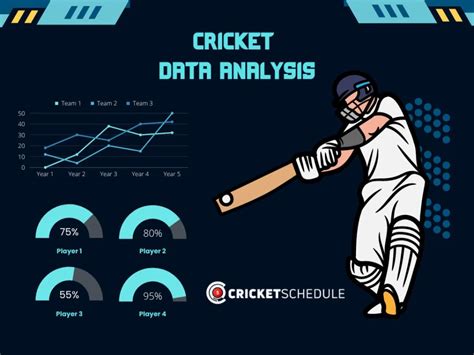
Data visualization plays a crucial role in analyzing cricket statistics by transforming complex data sets into easily interpretable graphical representations. This process not only aids analysts in identifying patterns and trends but also enhances the ability to communicate insights effectively to a broader audience. Here are some key ways in which data visualization enhances the analysis of cricket statistics:
- Clarity and Comprehension: Visual representations such as charts and graphs make it simpler to discern relationships and variations between different statistics, like player performances across different conditions or formats.
- Trend Analysis: Line graphs and bar charts can illustrate performance trends over time, allowing analysts and coaches to see how a player’s form fluctuates throughout the season, which helps in making strategic decisions.
- Comparative Analysis: Data visualization tools enable side-by-side comparisons of players’ statistics, assisting selectors in making informed choices based on visual cues rather than just numbers.
- Interactive Dashboards: Advanced data visualization platforms allow users to interact with the data, filtering it by parameters such as match type, opponent, or playing conditions, thus providing tailored insights into specific scenarios.
- Enhanced Storytelling: Visualizations can tell a compelling story, often making the data more relatable and engaging for fans and analysts alike. By presenting statistics in a narrative format, viewers can better understand the context of the game.
- Real-Time Analysis: During matches, live visualizations can provide instant insights, helping teams to adjust their strategies based on ongoing performance metrics.
The integration of data visualization tools in analyzing cricket statistics not only enriches the insight-gathering process but also bridges the gap between data analysts, players, and fans, creating a more informed and engaged cricketing community.
Real-World Applications Of Analyzing Cricket Statistics
Analyzing cricket statistics plays a pivotal role in various aspects of the sport, enhancing both gameplay and strategic decision-making. The effective application of these statistics can be observed in the following areas:
| Application | Description |
|---|---|
| Player Selection | Coaches and selectors utilize statistical analysis to identify the best players suited for specific formats and conditions, ensuring a balanced team selection. |
| Match Strategy | Analyzing bowler and batsman stats to devise game plans, such as exploiting opponents’ weaknesses and enhancing team strengths. |
| Performance Evaluation | Through analyzing cricket performance metrics, teams can evaluate individual and collective performances, driving players’ development. |
| Sponsorship and Marketing | Statistics can attract sponsors by showcasing player and team performances, thus leveraging data for endorsements and revenue-generating opportunities. |
| Fan Engagement | Teams and analysts share insights and statistics with fans to enhance audience engagement, making cricket more interactive and appealing. |
These applications of analyzing cricket statistics not only foster a deeper understanding of the game but also contribute to the overall growth and professionalism of cricket as a sport. By implementing data-driven strategies, teams can gain a significant competitive advantage.
Improving Your Game Through Analyzing Cricket Performance Metrics
When it comes to analyzing cricket, understanding performance metrics is crucial for players at all levels. These metrics help to pinpoint strengths and weaknesses in a player’s game, allowing for targeted improvements. Here are several key areas where performance metrics can boost your cricket skills:
| Performance Metric | Description | How It Helps |
|---|---|---|
| Batting Average | The mean number of runs scored per innings. | Identifies consistency in a player’s batting and can highlight areas for improvement. |
| Strike Rate | Runs scored per 100 balls faced. | Helps in assessing how effectively a player can score runs, especially in limited-overs cricket. |
| Bowling Average | The average number of runs conceded per wicket taken. | Enables bowlers to understand their effectiveness and strategy on the field. |
| Economy Rate | The average number of runs conceded per over bowled. | Critical for evaluating a bowler’s ability to restrict runs in both limited-overs and test cricket. |
| Fielding Percentage | The ratio of successful fielding actions to total attempts. | Provides insight into fielding efficiency and areas that require pre-match practice. |
By closely analyzing cricket performance metrics, players can establish individual benchmarks and set realistic improvement goals. Coaches can also leverage these metrics to design personalized training programs that address specific challenges faced by each player. Ultimately, utilizing performance data not only enhances individual skills but also contributes to the overall strength of the team.
Frequently Asked Questions
What is the importance of analyzing cricket statistics?
Analyzing cricket statistics helps fans, players, and teams understand performance trends, make informed decisions, and enhance strategies for future matches.
How do we define batting average in cricket?
Batting average is calculated by dividing the total number of runs a batsman has scored by the number of times they have been out, offering a clear representation of their consistency and ability.
What role do bowling figures play in evaluating a bowler’s performance?
Bowling figures, such as wickets taken and runs conceded, are crucial metrics that evaluate a bowler’s effectiveness in matches, helping to gauge their impact on the game.
What is the significance of strike rate in cricket batting?
The strike rate measures the number of runs scored per 100 balls faced, indicating how quickly a batsman can score, which is vital in limited-overs cricket.
How can team statistics differ from individual player statistics?
Team statistics aggregate the performance of all players in a team, while individual player statistics focus solely on the performance of one player, which can reveal strengths and weaknesses in context.
What are some advanced statistics used in modern cricket analysis?
Advanced statistics like player impact scores, economy rates, and batting centurion profiles provide deeper insights into player efficiency and match contributions beyond traditional metrics.
Why is it essential to consider conditions when analyzing cricket statistics?
Conditions such as pitch type, weather, and match location can significantly affect player performances; thus, context is crucial for interpreting statistics accurately.


